I just finished a draft for next week on Big Data and thought that with this note I might form a preface…
First… Big Data is about, well…, Big Data. When Gartner devised the three V’s I suspect that they were trying to frame the new stuff that was emerging… not establish a concise definition. So let me be very clear about what I think that Big Data is and is not.
Big Data is about volume, not velocity, not variety. That is what the words “big” and “data” conjoined must mean. Velocity + Volume is Big Data. Variety + Volume is Big Data. By themselves Velocity and Variety are new, important, separate, technological trends.
Next, Big Data is a new thing. It is not a technology that was around in a meaningful way 5+ years ago. It was emerging just then so we should see evidence in the advances offered by the Web Scale companies like Google, Yahoo, and Netflix. It is not any data that was conventionally created, captured, or used before 2010 or so.
So what is new, big, and was emerging in recent history? It is the creation, capture, and use of machine-generated data: click-stream data, system log data, and sensor data. Big Data technology has to do with the creation, capture, and utilization of large volumes of machine-generated data… nothing more or less.
Rob: Big Data legitimately includes Social Data as well as Vitaliy rightfully commented… I’ll post on this soon…
Machines generate data at a very low-level of detail. It is said that the devil is in the detail… and the subject of the next post deals with the notion that in order to make our companies more profitable we must all chase this damnable devil.
PS
I wonder if damnable devil is redundant? Probably, yes.
2nd PS (sort of like 2nd breakfast)
Big Data is not about any and every new technology introduced in the last five years…
Infographics by The Guardian (Photo credit: tripu)
I have been thinking about BI… prompted by a friend, Frank Bien, who is the CTO of Looker (you are welcome, Frank, for the plug…) but this post is about a trend in BI that is worth exploring… and only maybe about Looker or any other tool.
BI was originally about reporting… in its very first iterations users coded SQL directly, or used a 4GL scripting language, and the BI tool was there for formatting the output. Then more focus was put on query-building to make it easier for developers to effectively get the required data.
There was lots of talk at this point about knowledge-workers and do-it-yourself BI… but it never really worked out that way. Business users requested canned reports and went to a query guru to request special reports as required.
The following was pretty normal: after finding some interesting fact in a tabular report a business user would pull the data and build a Powerpoint slide to present the results. As interfaces improved you soon could access the data directly and create Excel or Powerpoint charts without copying the data by hand. In other words data visualization was separated from reporting.
The BI vendors caught on to this, recognizing that data presentation is important, and soon all of the BI tools offered some charting options. But the next step was equally interesting. Charting is a bit of an art… so the BI tools programmed in some directives to help you select the chart that fit your data and that would be visually pleasing. So simple charting as visualization was built-in with some simple assistance to help you with the simple art of presentation.
From here vendors went in two directions, one after the other.
First, dashboards were developed that were customizable and these applications, either semi-static or dynamic, caught your eye. Red lights and limits could be built into a heads-up display. The art of presentation was pretty crude and loudness: bright colors and lots of moving dials and eye-candy won the day. But as far as presentation goes, dashboards are just multiple simple charts arranged on a screen. QlikView led this charge.
Next, a new set of visualization products were rolled out by vendors like Tableau and Pentaho. Users saw that some very powerful pictures could be drawn showing data in a time series… and showing the series changing over time. Since the presentation was more nuanced and more “artistic” the automated assistance required more sophistication and this is where the vendors are now fighting to differentiate themselves.
But an interesting thing was happening outside BI… and this is the point of this note. In the same way that PowerPoint led reporting to charting, a new presentation technique called infographics is emerging. It is the state of the art in data visualization… and Powerpoint… and art… rolled into one. And it is very impactful. I imagine that the next wave of BI tools must embrace this more advanced presentation technique.
Here is how I think this plays out.
The advanced data visualization vendors will provide a palette that directly accesses data, and big data, to allow very custom infographics… you can see some of this at Piktochart although it is more about templates than free form development. But since this is art… tools will be developed that help the art-impaired like me to build nice displays and they will do this by analyzing the data and recommending one or more meaningful infographic displays.
So, maybe in the same way that Powerpoint data presentation anticipated charting in BI tools… Infographics anticipates the next data presentation facility for BI.
I suppose that this is not really a controversial conclusion… and I imagine that if I took the time I could find several start-ups who are way ahead of me on this… but sometimes it’s more fun to daydream it up on my own… and pretend that I’m out front…
The current release of HANA requires that all of the data required to satisfy a query be in-memory to run the query. Let’s think about what this means:
HANA compresses tables into bitmap vectors… and then compresses the vectors on write to reduce disk I/O. Disk I/O with HANA? Yup.
Once this formatting is complete all tables and partitions are persisted to disk… and if there are updates to the tables then logs are written to maintain ACIDity and at some interval, the changed data is persisted asynchronously as blocks to disk. When HANA cold starts no data is in-memory. There are options to pre-load data at start-up… but the default is to load data as it is used.
When the first query begins execution the data required to satisfy the query is moved into memory and decompressed into vectors. Note that the vector format is still highly compressed and the execution engine operates on this compressed vector data. Also, partition elimination occurs during this data move… so only the partitions required are loaded. The remaining data is on disk until required.
Let us imagine that after several queries all of the available memory is consumed… but there is still user data out-of-memory on peripheral storage… and a new query is submitted that requires this data. At this point HANA frees enough storage to satisfy the new query and processes it. Note that, in the usual DW case (write-once/read-many), the data flushed from memory does not need to be written back… the data is already persisted… otherwise HANA will flush any unwritten changed blocks…
If a query is submitted that performs a cartesian product… or that requires all of the data in the warehouse at once… in other words where there is not enough memory to fit all of the vectors in memory even after flushing everything else out… the query fails. It is my understanding that this constraint will be fixed in a next release and data will stream into memory and be processed in-stream instead of in-whole. Note that in other databases a query that consumes all of the available memory may never complete, or will seriously affect all other running queries, or will lock the system… so the HANA approach is not all bad… but as noted there is room for improvement and the constraint is real.
This note should remove several silly arguments leveled by HANA’s competitors:
HANA, and most in-memory databases, offer full ACID-compliance. A system failure does not result in lost data.
HANA supports more data than will fit in-memory and it pages data in-and-out in a smart fashion based on utilization. It is not constrained to only data that fits in-memory.
HANA is not useless when it runs out of memory. HANA has a constraint when there is more data than memory… it does not crash the system… but lets be real… if you page data to disk and run out of disk you are in trouble… and we’ve all seen our DBMS‘s hit this wall. If you have an in-memory DBMS then you need to have enough memory to support your workload… if you have a DB2 system you better not run out of temp space or log space on disk… if you have Teradata you better not run out of spool space.
I apologize… there is no public reference I know of to support the features I described. It is available to HANA customers in the HANA Blue Book. It is my understanding that a public version of the Blue Book is being developed.
A 30 feet chunk of the cliff below the apartment building fell to Pacific Ocean. (Photo credit: Wikipedia)
Jason asked a great question in the comment section here… he asked… does Teradata’s Intelligent Memory erode HANA’s value proposition? Let me answer here in a more general way that is applicable to the general database space…
Every time a vendor puts more silicon between the CPU and the disk they will improve their performance (and increase their price). Does this erode HANA’s value proposition? Sure. Every advance by any vendor erodes every other vendor’s position.
To win business a new database product has to be faster than the competition. In my experience you have to be at least 30% faster to unseat the incumbent. If you are 50% faster you will win a lot of business. If you are 2x, 100%, faster you win nearly every time.
Therefore the questions are:
Did the Teradata announcement eliminate a set of competitors from reaching these thresholds when Teradata is the incumbent? Yup. It is very smart.
Does Intelligent Memory allow Teradata to reach these thresholds when they compete against another incumbent. Yup.
Did it eliminate HANA from reaching these thresholds when competing with Teradata? I do not think so… in fact I’m pretty sure it is not the case… HANA should still be way over the 2x threshold… but the reasons why will require a deeper dive… stay tuned.
In the picture attached a 30 foot chunk eroded… but Exadata still stands. Will it be condemned?
Note: Here is a commercial post on the SAP HANA blog site that describes at a high level why I think HANA retains a distinct architectural advantage.
Cloudera and Teradata have jointly published a nice paperhere that presents an interesting perspective of how Hadoop and an EDW play together. Simply put, Hadoop becomes the staging area for “raw data streams” while the EDW stores data from “operational systems”. Hadoop then analyzes the raw data and shares the results with the EDW. Two early examples provided suggest:
Click stream data is analyzed to identify customer preferences that are then shared with the EDW. Note that the amount of data sent from Hadoop to the EDW would be fairly small in this case.
Detailed data is stored on Hadoop to build analytic models. The models are then transferred to the EDW to score sales activity data. Note that in this scenario the scored activity detail has to live in Hadoop to perform modeling… but it is unclear why it has to live in the EDW as well. I presume that scoring takes place on the EDW instead of in Hadoop for performance reasons… but maybe the data, the modeling, and the scoring should just take place in Hadoop?
The paper then positions Hadoop as an active archive. I like this idea very much. Hadoop can store archived data that is only accessed once a month or once a quarter or less often… and that data can be processed directly by Hadoop programs or shared with the EDW data using facilities such as Teradata’s SQL-H, or Greenplum‘s External Hadoop tables (not by HAWQ, though… see here), or by other federation engines connected to HANA, SQL Server, Oracle, etc.
But think about the implications on how much data has to stay in your EDW if you archive everything older than 90, or even 180, days to Hadoop. The EDW shrinks significantly and the TCO advantage to your Enterprise will be significant. This is very cool.
There is one item in the paper I disagree with, though… and another statement that I think has a very short shelf-life.
The paper suggests that indexes, materialized views, aggregate join indexes, and other tweaks are what differentiates an EDW. I believe that reliance on these structures make for a fragile EDW where only some queries can run fast. I like Teradata better when it just robustly scans fast and none of these redundant-data tuning artifacts are required (more here and here). Teradata was the original scan-fast DBMS… it is more than capable.
The paper also suggests that an EDW maintains value by including a sophisticated cost-based optimizer that uses data demographic statistics to identify an optimal query execution plan. I agree that Hadoop lacks this now… but there are several projects like Cloudera Impala that will eliminate this gap in the near term.
I believe that if you read between the lines you will see more evidence to support my belief (here) that Hadoop will squeeze the EDW vendors hard… and that the size of a squeezed EDW will then fit in an in-memory database.
If you missed the tweet… 2+ years ago I predicted here that Teradata would go away from ByNet… and lo and behold they did (see here).
In the same post I predicted that Netezza would go away from FPGAs. This has not come to pass. But I wonder if it might… or if there is a bigger change possible?
With the recent announcements of DB2 BLU and column store I suspect that DB2 will outperform Netezza when the query mix does not fall directly in Netezza’s sweet spot.
I also have a suspicion that the Netezza architecture, with its execution engine split across two different processors, is just hard to engineer. I cannot think of another reason features come so slowly there. Why, for example, is there no columnar support? Greenplum built it on the same Postgres base with less than a handful of engineers in a year. Teradata now offers columnar tables as well.
These concerns… combined with some previous notes on Netezza add up as follows:
FPGAs no longer provide a performance advantage (per my link above)
FPGAs limit the ability of the DBMS to use more cores (see here)
FPGAs limit the ability of the DBMS to manage workload (see here… and especially the comments)
FPGAs and having a 2-phase split execution environment limits the ability to extend and enhance the code base (a new conjecture)
Zone Maps and CBTs provide a limited ability to solve for a wide range of queries… they are just an index (see here)
DB2 Column Store provides a performance boost equal to or greater than zone maps and CBTs (a new conjecture)
DB2 BLU provides a performance boost well in excess of what Netezza can provide (see here)
The Netezza architecture with FPGAs provided a distinct advantage in 2000 when CPU was the scarce commodity. But multi-core systems and the advance of Moore’s Law soon made processing abundant… and the advantage of FPGA co-processing diminished. Without a distinct advantage the split execution architecture became a disadvantage… and the complexity of that design kept Netezza from developing the advances on top of the Postgres base that were very easy to develop by others.
Architecture counts… and DB2 is a strong product. If, as I suspect, DB2 is now a more capable product than Netezza… I wonder what path IBM may take?
6 May… There is a good summary of this post and on the comments here. – Rob
17 April… A single unit of parallelism is a core plus a thread/process to feed it instructions plus a feed of data. The only exception is when the core uses hyper-threading… in which case 2 instructions can execute more-or-less at the same time… then a core provides 2 units of parallelism. All of the other stuff: many threads per core and many data shards/slices per thread are just techniques to keep the core fed. – Rob
16 April… I edited this to correct my loose use of the word “shard”. A shard is a physical slice of data and I was using it to represent a unit of parallelism. – Rob
I made the observation in this post that there is some inefficiency in an architecture that builds parallel streams that communicate on a single node across operating system boundaries… and these inefficiencies can limit the number of parallel streams that can be deployed. Greenplum, for example, no longer recommends deploying a segment instance per core on a single node and as a result not all of the available CPU can be applied to each query.
This blog will outline some other interesting limits on the level of parallelism in several products and on the definition of Massively Parallel Processing (MPP). Note that the level of parallelism is directly associated with performance.
On HANA a thread is built for each core… including a thread for each hyper-thread. As a result HANA will split and process data with 80 units of parallelism on a high-end 40-core Intel server.
Exadata deploys 12 cores per cell/node in the storage subsystem. They deploy 12 disk drives per node. I cannot see it clearly documented how many threads they deploy per disk… but it could not be more than 24 units of parallelism if they use hyper-threading of some sort. It may well be that there are only 12 units of parallelism per node (see here).
Updated April 16: Netezza deploys 8 “slices” per S-Blade… 8 units of parallelism… one for each FPGA core in the Twin times four (2X4) Twinfin architecture (see here). The next generation Netezza Striper will have 16-way parallelism per node with 16 Intel cores and 16 FPGA cores…
Updated April 17: Teradata uses hyper-threading (see here)… so that they will deploy 24 units of parallelism per node on an EDW 6700C (2X6X2) and 32 units of parallelism per node on an EDW 6700H (2X8X2).
You can see the different definitions of the word “massive” in these various parallel processing systems.
Note that the next generation of Xeon processors coming out later this year will have 8X15 processors or 120 cores on a fat node:
This will provide HANA with the ability to deploy 240 units of parallelism per node.
Netezza will have to find a way to scale up the FPGA cores per S-Blade to keep up. TwinFin will have to become QuadFin or DozenFin. It became HexadecaFin… see above. – Rob
Exadata will have to put 120 SSD/disk drive combos in each node instead of 12 if they want to maintain the same parallelism-to-disk ratio with 120 units of parallelism.
Teradata will have to find a way to get more I/O bandwidth on the problem if they want to deploy nodes with 120+ units of parallelism per node.
Most likely all but HANA will deploy more nodes with a smaller number of cores and pay the price of more servers, more power, more floor space, and inefficient inter-node network communications.
If Greenplum HAWQ does not look promising (see my previous posts on HAWQ here and here) what are the prospects for TeradataAster Data… which aspires to both replace and/or co-exist with Hadoop for a fee? Teradata+Hadoop maybe… but Teradata+Aster+Hadoop seems like one layer too many… as does Aster+Hadoop.
(OK, I removed the bad “HAWQing” pun in the title… no complaints from readers… it just seemed unfair… – Rob)
Since my blogs tend to be in response to some stimulus they may not reflect a holistic view on any particular product. The “My 2 Cents” series will try to provide a broader view…
From a technical perspective, Greenplum is my favorite data warehouse database. Built on the same architecture as Teradata (see here), the Greenplum team was able to extend the core of Postgres… first building out a shared-nothing architecture and then adding feature after feature… putting the heat on the other major players. Greenplum was the first row-based RDBMS to add full columnar support… and their data-loading capability is second-to-none.
Oddly they do not want to be in the data warehouse space. Their recent announcement (here) does not include any reference to data warehousing or business intelligence. The tweets from @Greenplum, the Greenplum website, and all things marketing are focussed on analytics and/or Hadoop. Even their page on data warehousing (here) has no articles on data warehousing. It is just not their target market. That is fine… the product is still a great EDW platform… but it is a worry.
Where They Win
The reason they target analytics is because they excel there. If your warehouse workload clogs because of big, complex, queries… Greenplum can win the day. Their data flow architecture, which keeps tuples moving from execution step to execution step without writing to spool provides them with the ability to beat the competition on analytics. They provide a very rich set of in-database analytics and some add-on capabilities to improve the productivity of your data scientist team.
Their data load architecture, which they call scatter-gather, is a big differentiator. If your problem is that you cannot get data loaded and reports out in your nightly batch window then the combination of scatter-gather and the ability to run big report queries is unbeatable.
Greenplum also has a unique solution for near-real-time. They marry Gemfire, an in-memory object-oriented database, with scatter-gather to move small batches of inserted data to Greenplum with a very small time delta. I do not believe this solution supports inserts or deletes as they have to be applied directly to the Greenplum database… but it is a nice capability for a certain class of problems.
Where They Lose
Greenplum, like Teradata, can be beat when the problem to be solved is narrow. In these cases, when the database supports a single application with a small number of queries or when it supports a narrowly focussed data mart, they are vulnerable to Netezza, Vertica, or even Exadata. It is also sometimes the case that a poorly designed POC can narrow the scope enough that Greenplum loses.
Greenplum can also lose when a full EDW is required. The basic architecture of the RDBMS is capable of supporting an EDW… but some of the operational features required… RASR, workload, incremental backup, etc. are not mature. This may well be the intentional result of their focus away from these features at analytics.
In the Market
Despite the worries Greenplum should be included in every POC. They will push Teradata hard in performance and in price/performance.
As noted here… I do not understand their market strategy. It seems that they are competing with themselves by offering Hadoop for analytics… but this cannot be a bad thing for customers even if it is an odd position in the market. The analytics market they favor is tough… relatively small (compared to the DW space)… emerging… there are several capable competitors… and the market is haunted by the same problem that killed the data mining market in the mid-1990’s… there are just not enough skilled data scientists (see here).
My Guess at the Future
I cannot guess at the future of Greenplum… They are being moved into a new business unit that could be spun into a new company that has a charter to build software for the cloud (see here). This is odd in several dimensions. First, as I noted here, the shared nothing architecture Greenplum is built on is not a perfect fit for the cloud. There are ways to get around this (maybe the topic for a future post?) but it will require development in a fundamentally new direction. Further, the new division seems to be a software-only venture. This makes the future of the EMC Greenplum Data Computing Appliance uncertain. I suppose that there will be announcements soon to clarify these questions… but the architectural disconnects make it likely that there will be some arm-waving for a while.
If I were the Register I would have titled this: Raging Stuffed Elephant To Devour Two Warehouse Vendors… I love the Register… if you do not read it have a look…
This is a post is about the market implications of architecture…
Let us assume that Hadoop matures and finds a permanent place in the market. This is not certain with some folks expressing concern (here) and others boundless enthusiasm (here). So let’s assume… and consider where it might fit.
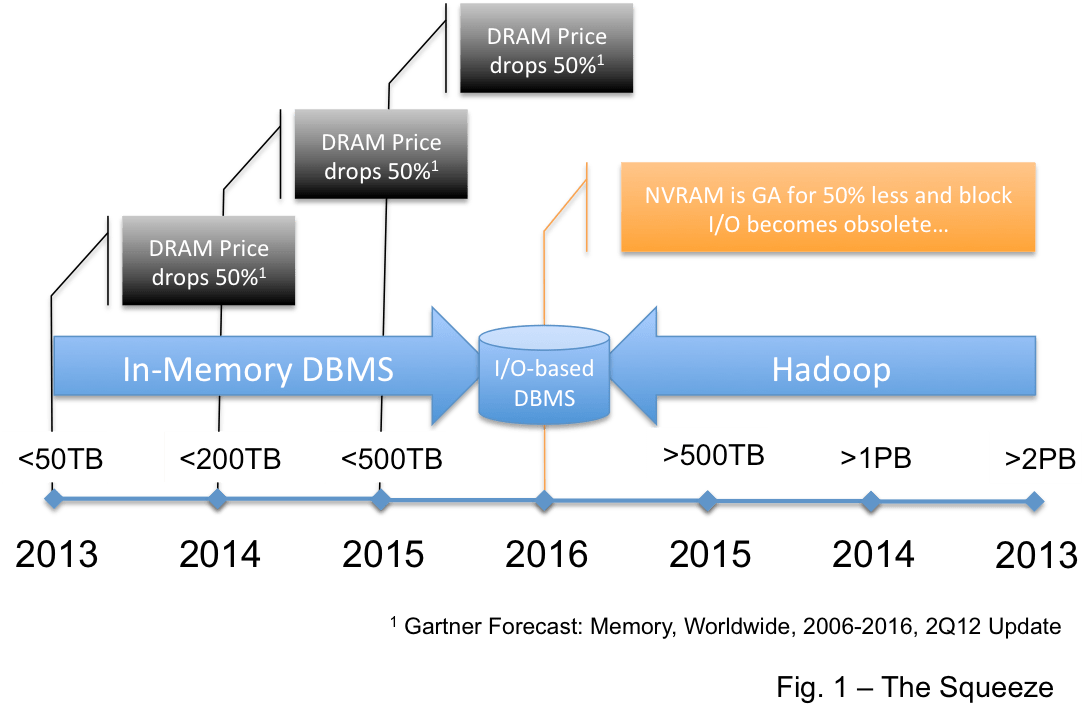
One place is in the data warehouse market… This view says Hadoop replaces the DBMS for data warehouses. But the very mature BI/DW market requires a high level of operational integrity and Hadoop is not there yet… it is advancing rapidly as an enterprise platform and I believe it will get there… but it will be 3-4 years. This is the thinking I provided here that leads me to draw the picture in Figure 1.
It is not that I believe that Hadoop will consume the data warehouse market but I believe that very large EDW’s… those over 1PB… and maybe over 500TB will be compelled by the economics of “free” to move big warehouses to Hadoop. So Hadoop will likely move down into the EDW space from the top.
Another option suggests that Big Data will be a platform unto itself. In this view Hadoop will sit beside the existing BI/DW platform and feed that platform the results of queries that derive structure from unstructured data… and/or that aggregate Big Data into consumable chunks. This is where Hadoop sits today.
In data warehouse terms this positions Hadoop as a very large independent analytic data mart. Figure 2 depicts this. Note that an analytics data mart, and a Hadoop cluster, require far less in the way of operational infrastructure… they share very similar technical requirements.
This leads me to the point of this post… if Hadoop becomes a very large analytic data mart then where will Greenplum and Netezza fit in 2-3 years? Both vendors are positioning themselves in the analytic space… Greenplum almost exclusively so. Both vendors offer integrated Hadoop products… Greenplum offers the Greenplum database and Hadoop in the same hardware cluster (see here for their latest announcement)… Netezza provides a Hadoop connector (here). But if you believe in Hadoop… as both vendors ardently do… where do their databases fit in the analytics space once Hadoop matures and fully supports SQL? In the next 3-4 years what will these RDBMSs offer in the big data analytics space that will be compelling enough to make the configuration in Figure 3 attractive?
I know that today Hadoop cannot do all that either Netezza or Greenplum can do. I understand that Netezza has two positions in the market… as an analytic appliance and as a data mart appliance… so it may survive in the mart space. But the overlap of technical requirements between Hadoop and an analytic data mart… combined with the enormous human investment in Hadoop R&D, both in the core and in the eco-system… make me wonder about where “Big Data” analytic relational databases will fit?
Note that this is not a criticism of the Greenplum RDBMS. Greenplum is a very fine product, one of the best EDW platforms around. I’ll have more to say about it when I provide my 2 Cents… But if Figure 2 describes the end state for analytics in 2-3 years then where is the place for the Figure 3 architecture? If Figure 3 is the end state then I do not see where the line will be drawn between the analytic workload that requires Greenplum and that that will run on Hadoop? I barely can see it now… and I cannot see it at all in the near future.
Both EMC Greenplum and IBM seem to strongly believe in Hadoop… they must see the overlap in functionality and feel the market momentum of Hadoop. They must see, better than most, that Hadoop wins this battle.